Time Series
In this site, the selected theoretical and real case studies are introduced. The Lorenz system, the Hénon map and the Rössler system form the theoretical cases, which are classical examples of discrete -and continuous- time chaotic systems. Real cases are formed by a ECG signal and a temperature time series, which are in the framework of the research projects implied in this work.
The Lorenz System
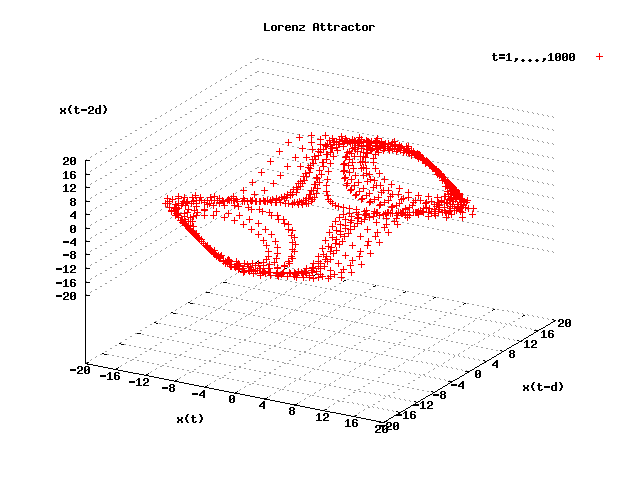
The Lorenz system shows how the state of a dynamical system (the three variables of a three-dimensional system) evolves over time in a complex, non-repeating pattern. The equations that describe the system were introduced by E. Lorenz in 1963, which derived it from the simplified equations of convection rolls arising in the equations of the atmosphere. The next figure depicts the Lorenz attractor using a part of the Lorenz time series which can be downloading
here. A value of time delay equal to
d=7 was used to obtain the points in delay coordinates.
The Hénon Map
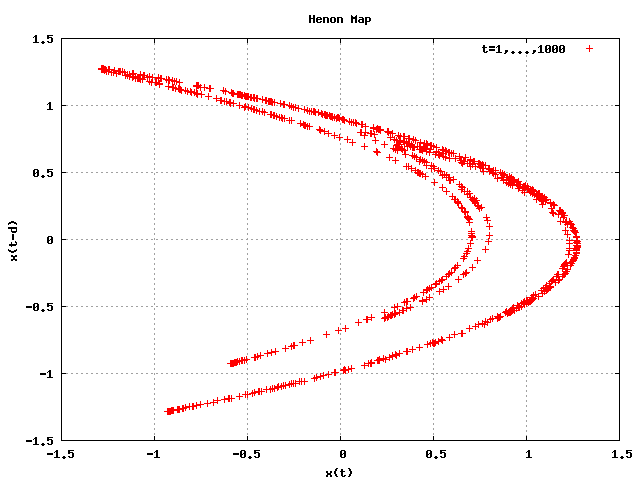
The Hénon map is a discrete-time dynamical system. It is one of the most widely studied examples of dynamical systems that exhibit chaotic behavior. The next figure depicts the Hénon map using a part of the Hénon time series which can be downloading
here. A value of time delay equal to
d=1 was used to obtain the points in delay coordinates.
The Rössler System
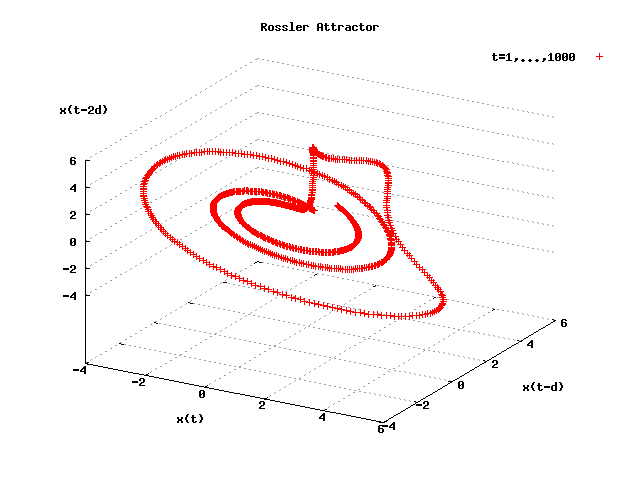
This case study consists of a system of three nonlinear ordinary differential equations. These differential equations define a continuous-time dynamical system that exhibits chaotic dynamics. The next figure depicts the Rössler attractor using a part of the Rössler time series which can be downloading
here. A value of time delay equal to
d=60 was used to obtain the points in delay coordinates.
A Electrocardiography Signal
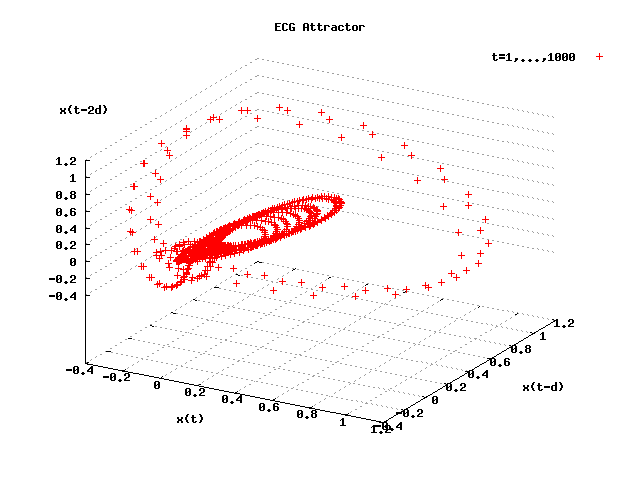
ElectroCardioGraphy (ECG) is a transthoracic interpretation of the electrical activity of the heart over time captured and externally recorded by skin electrodes. It is a noninvasive recording produced by an electrocardiographic device. The next figure depicts a ECG signal attractor using a part of the ECG time series which can be downloading
here. A value of time delay equal to
d=5 was used to obtain the points in delay coordinates.
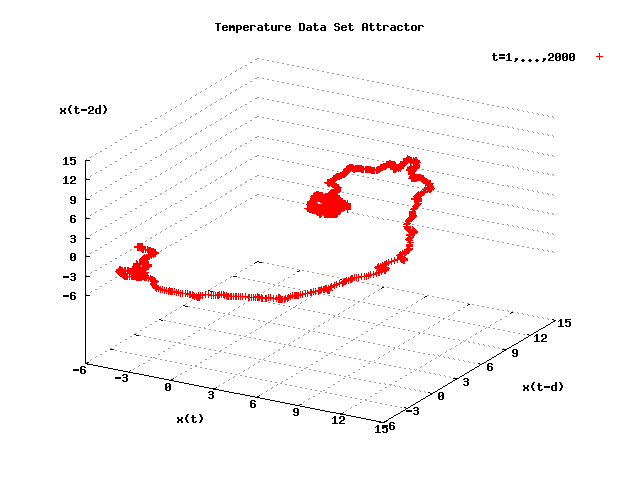
An Air Temperature Data Set
The weather data used in the experiments have been recorded by a meteorological station located on the top of the
Escuela Superior de Ingeniería Informática de Albacete building, University of Castilla-La Mancha. This building is placed in the urban area of Albacete (Spain). The meteorological station is property of the
Interdisciplinary Research Group in Dynamical Systems (IRGDS). The next figure depicts a temperature data set attractor using a part of the Temperature time series which can be downloading
here. A value of time delay equal to
d=100 was used to obtain the points in delay coordinates.
Last change: February 16th, 2011.
© 2011 by Julio José Águila Guerrero et al.